Solar
Q3 2022 - Solar Price Update
Solar prices hold steady while electricity rates continue to rise.
LGC solar systems show greatest drop in price since mid 2021.
The end of last year saw a swing in demand for commercial solar. Businesses raced to procure onsite generation to alleviate some of their rising electricity bills. Since then, there has been a cap in coal & gas prices which curbed the price rises, and the panic has subsided somewhat. Now, we are seeing a swing the other way. As solar retailers race to fill their pipelines with larger projects, system prices have dropped again.
Things have been moving quick in 2023 and I am suddenly 5 weeks late on the quarterly price index update. So what has been happening in the commercial solar space since the break of the new year? Our last update discussed a price increase in commercial solar systems as a result of rising electricity prices which in turn pushed up demand for solar (you can read about it here).
This past quarter, we noticed more bids from solar retailers on each project, an increased eagerness to win work, and more competitive pricing as a result. It seems the surge in demand has eased and now solar retailers are eager to fill their pipelines for the remainder of 2023.
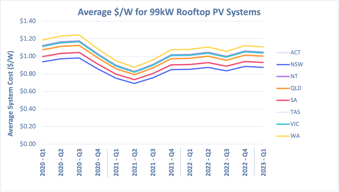
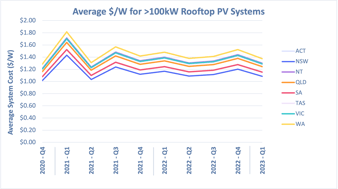
Based on systems offered through the Beam Solar platform in Q1 2023, we saw a 1% decrease in price for 99kW rooftop systems, and a whopping 10% decrease in price for rooftop systems sized greater than 100kW when compared with the previous quarter.
Other factors impacting solar system pricing in Australia such as raw material prices, freight charges, and AUD exchange, have all been in favour of cheaper system costs. These are summarised below.
Freight Prices:
Freight prices have continued to fall since peaking during mid 2022.
.png?width=398&height=265&name=FBX%20(1).png)
(Freightos Data, May 2023)
Raw Material Prices:
Raw material prices have also continued the downward trend since peaking in May last year.
.png?width=392&height=245&name=fredgraph%20(2).png)
(International Monetary Fund, Jan 2023)
AUD/USD Exchange Rate:
The AUD exchange rate has been fairly consistent, sitting close to 0.67-0.68 AUD/USD. A spike during mid Q1 would have temporarily decreased prices.

(Exchange Rates UK, Jan 2023)
So, international trade and freight is leaning in favour of cheaper systems for us in Aus, solar retailers are eager to win work, supply for commercial systems is high and price is low, and I wouldn't be surprised to see the price index come down even further in the Q2 update.
All things considered, it's a great time to buy.
If you are interested to start the solar procurement journey for your business, feel free to reach out to anyone on the Beam Solar Team, or click below to start your own Solar Assessment.

References:
Freightos Data - Freightos Baltic Index (FBX): Global Container Freight Index, https://fbx.freightos.com/, January 6, 2023.
International Monetary Fund - Global price of Agr. Raw Material Index [PRAWMINDEXM], retrieved from FRED, Federal Reserve Bank of St. Louis; https://fred.stlouisfed.org/series/PRAWMINDEXM, January 7, 2023.
Exchange Rates UK - Australian Dollar (AUD) to US Dollar (USD) exchange rate history, https://www.exchangerates.org.uk/AUD-USD-exchange-rate-history.html, January 8, 2023.
Solar prices hold steady while electricity rates continue to rise.