Solar prices increase as demand for commercial solar surges.
Q4 was another big one. The increased electricity rates in the forefront of everyones mind drove a commercial solar project surge as companies looked to offset rising bills. The year ended with an array of more complex and costly projects being contracted through the Beam Solar platform. This, paired with a higher demand for solar installation work, caused an increase in the solar price index for this past quarter.
Q4 finished with a bang and closed out what was the biggest year for Beam Solar to date. As a flow-on from the chaos caused by rising electricity prices towards the second half of 2022, projects were being contracted and implemented at light-speed. We had to expand our team to handle the increase in workload, and many of our solar retailers pipelines filled up quickly with projects scheduled well into 2023. The start of this surge was felt during our last price update in Q3 2022, where we discussed how electricity rates were significantly improving the payback on solar. However we were surprised to see that the solar price index stayed relatively stable over this period. It turns out the increased demand had a delayed affect as a rise in project cost was noticeable in the closing months of 2022.
Based on systems offered through the Beam Solar platform in Q4 2022, we saw a 6% increase in price for 99kW rooftop systems, and an 8% increase in price for rooftop systems sized greater than 100kW when compared with the previous quarter.


Other factors impacting solar system pricing in Australia such as raw material prices, freight charges, and AUD exchange rate have all moved in favour of cheaper costs since mid 2022. So we can assume that majority of the price sway is due to a surge in demand for commercial solar systems.
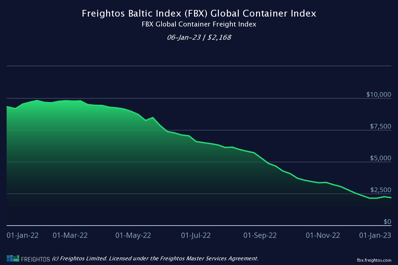
(Freightos Data, Jan 2023)
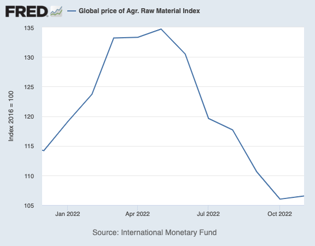

(International Monetary Fund, Jan 2023) (Exchange Rates UK, Jan 2023)
To give some context on the surge, generally we see businesses taking between 6-24 months to make an investment decision around commercial scale solar. This time frame spans our first interaction with a client, the detailed assessment work, initial and final offers rounds and contract negotiations. It is expected that businesses will take time to consider solar investment against many other competing propositions. After all, they have limited money to spend and many layers of approval are required before a project falls across the line. Inevitably, the whole process can take a long time.
In comparison, over the past 6 months we have seen many solar projects through Beam Solar take a fast-tracked approach. Whether it's due to a growing trust in the technology and solar industry, a stronger push towards green energy and emissions targets, or simply a better payback on solar, businesses are giving the green light on solar at a much faster rate. The average span of projects from initial meetings to contract execution was down 50% during the second half of 2022, with some being contracted 3 months after initial meetings.
We would love to take all the credit on this, but from conversations with our solar retailers, this surge has been felt industry wide. Installer pipelines have been filling up and as a result, prices have increased with the demand. Solar retailers have to pick-and-choose which projects they want to take on and this inherently causes prices to rise. As projects wrap up and installer availability begins to free up, we expect prices to dip again as we progress through 2023.
If you are interested to know what a solar and battery solution would look like for your business, feel free to reach out to anyone on the Beam Solar Team, or click below to start your own Solar Assessment.

References:
Freightos Data - Freightos Baltic Index (FBX): Global Container Freight Index, https://fbx.freightos.com/, January 6, 2023.
International Monetary Fund - Global price of Agr. Raw Material Index [PRAWMINDEXM], retrieved from FRED, Federal Reserve Bank of St. Louis; https://fred.stlouisfed.org/series/PRAWMINDEXM, January 7, 2023.
Exchange Rates UK - Australian Dollar (AUD) to US Dollar (USD) exchange rate history,https://www.exchangerates.org.uk/AUD-USD-exchange-rate-history.html, January 8, 2023.