May 5th, or Battery Day as it’s better known here at Beam, is the day we all sat down in one room and drew on our cross-discipline knowledge to determine how best to model battery savings for our clients. As a developer, the experience has been invaluable to furthering my relationship with our product, and a month along from that fabled day, it’s turning out to be quite an interesting, complex problem.
What is a battery model?
At the foundational level, this concept seems pretty straightforward. A battery model needs to:
- Decide when to store any excess solar generated locally (in the form of battery charge).
- Decide when to discharge the battery (to reduce the demand for grid sourced energy).
Simple, right? Well, no. It turns out that determining when it’s worth charging and/or discharging the battery from a financial standpoint varies wildly on the characteristics of the site. The main issue is that not all energy usage is considered equal. Each bill is significantly impacted by the maximum grid usage in any given month, a large spike of energy at any given interval period will often result in an expensive surprise. It’s therefore important to consider when to discharge the battery, and simply charging as much as possible and then discharging as early as possible (a process termed “load-following”) is far from the ideal method to optimise savings.
Peak lopping
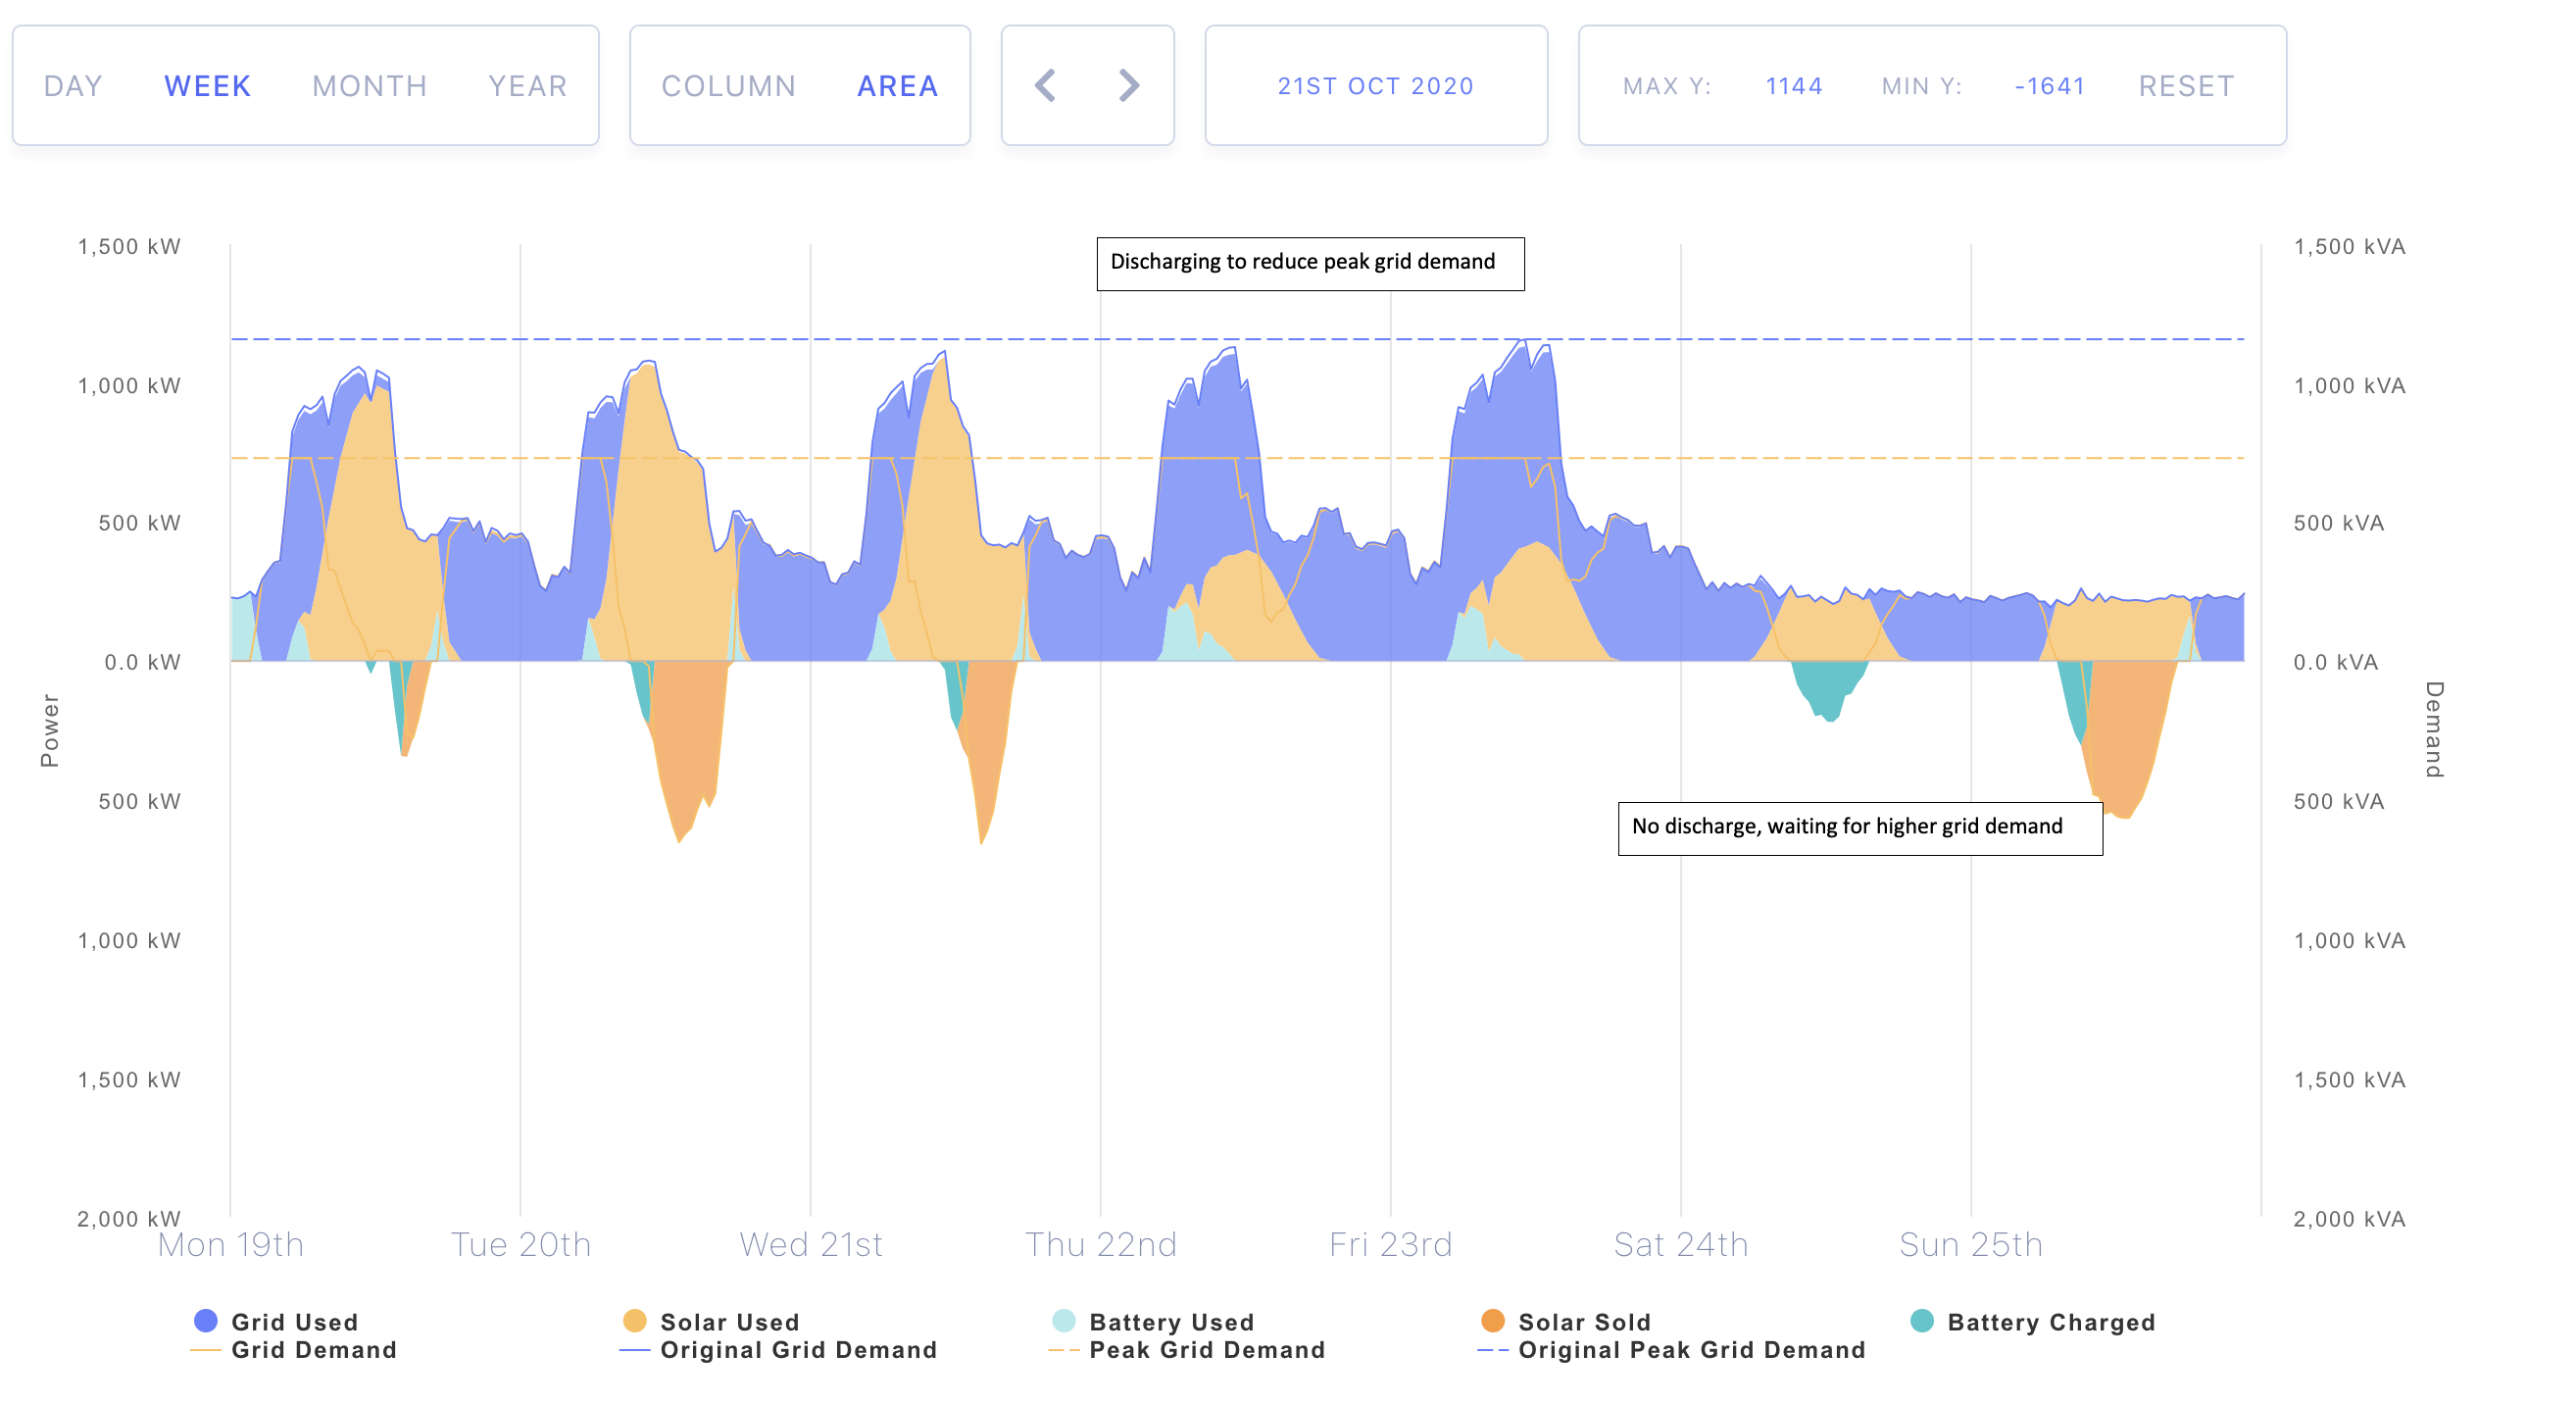
While simple load-following is better than nothing, making an effort to discharge the battery effectively at times of maximum demand (termed “peaks”) is the way to model the maximum savings potential. You can see this in peak lopping action in the case below. The solid blue line shows the original grid demand, and the dashed blue line represents the peak of this value for the week. The solid yellow line indicates the grid demand after any offset from solar or the battery and the dashed yellow line is its corresponding peak.

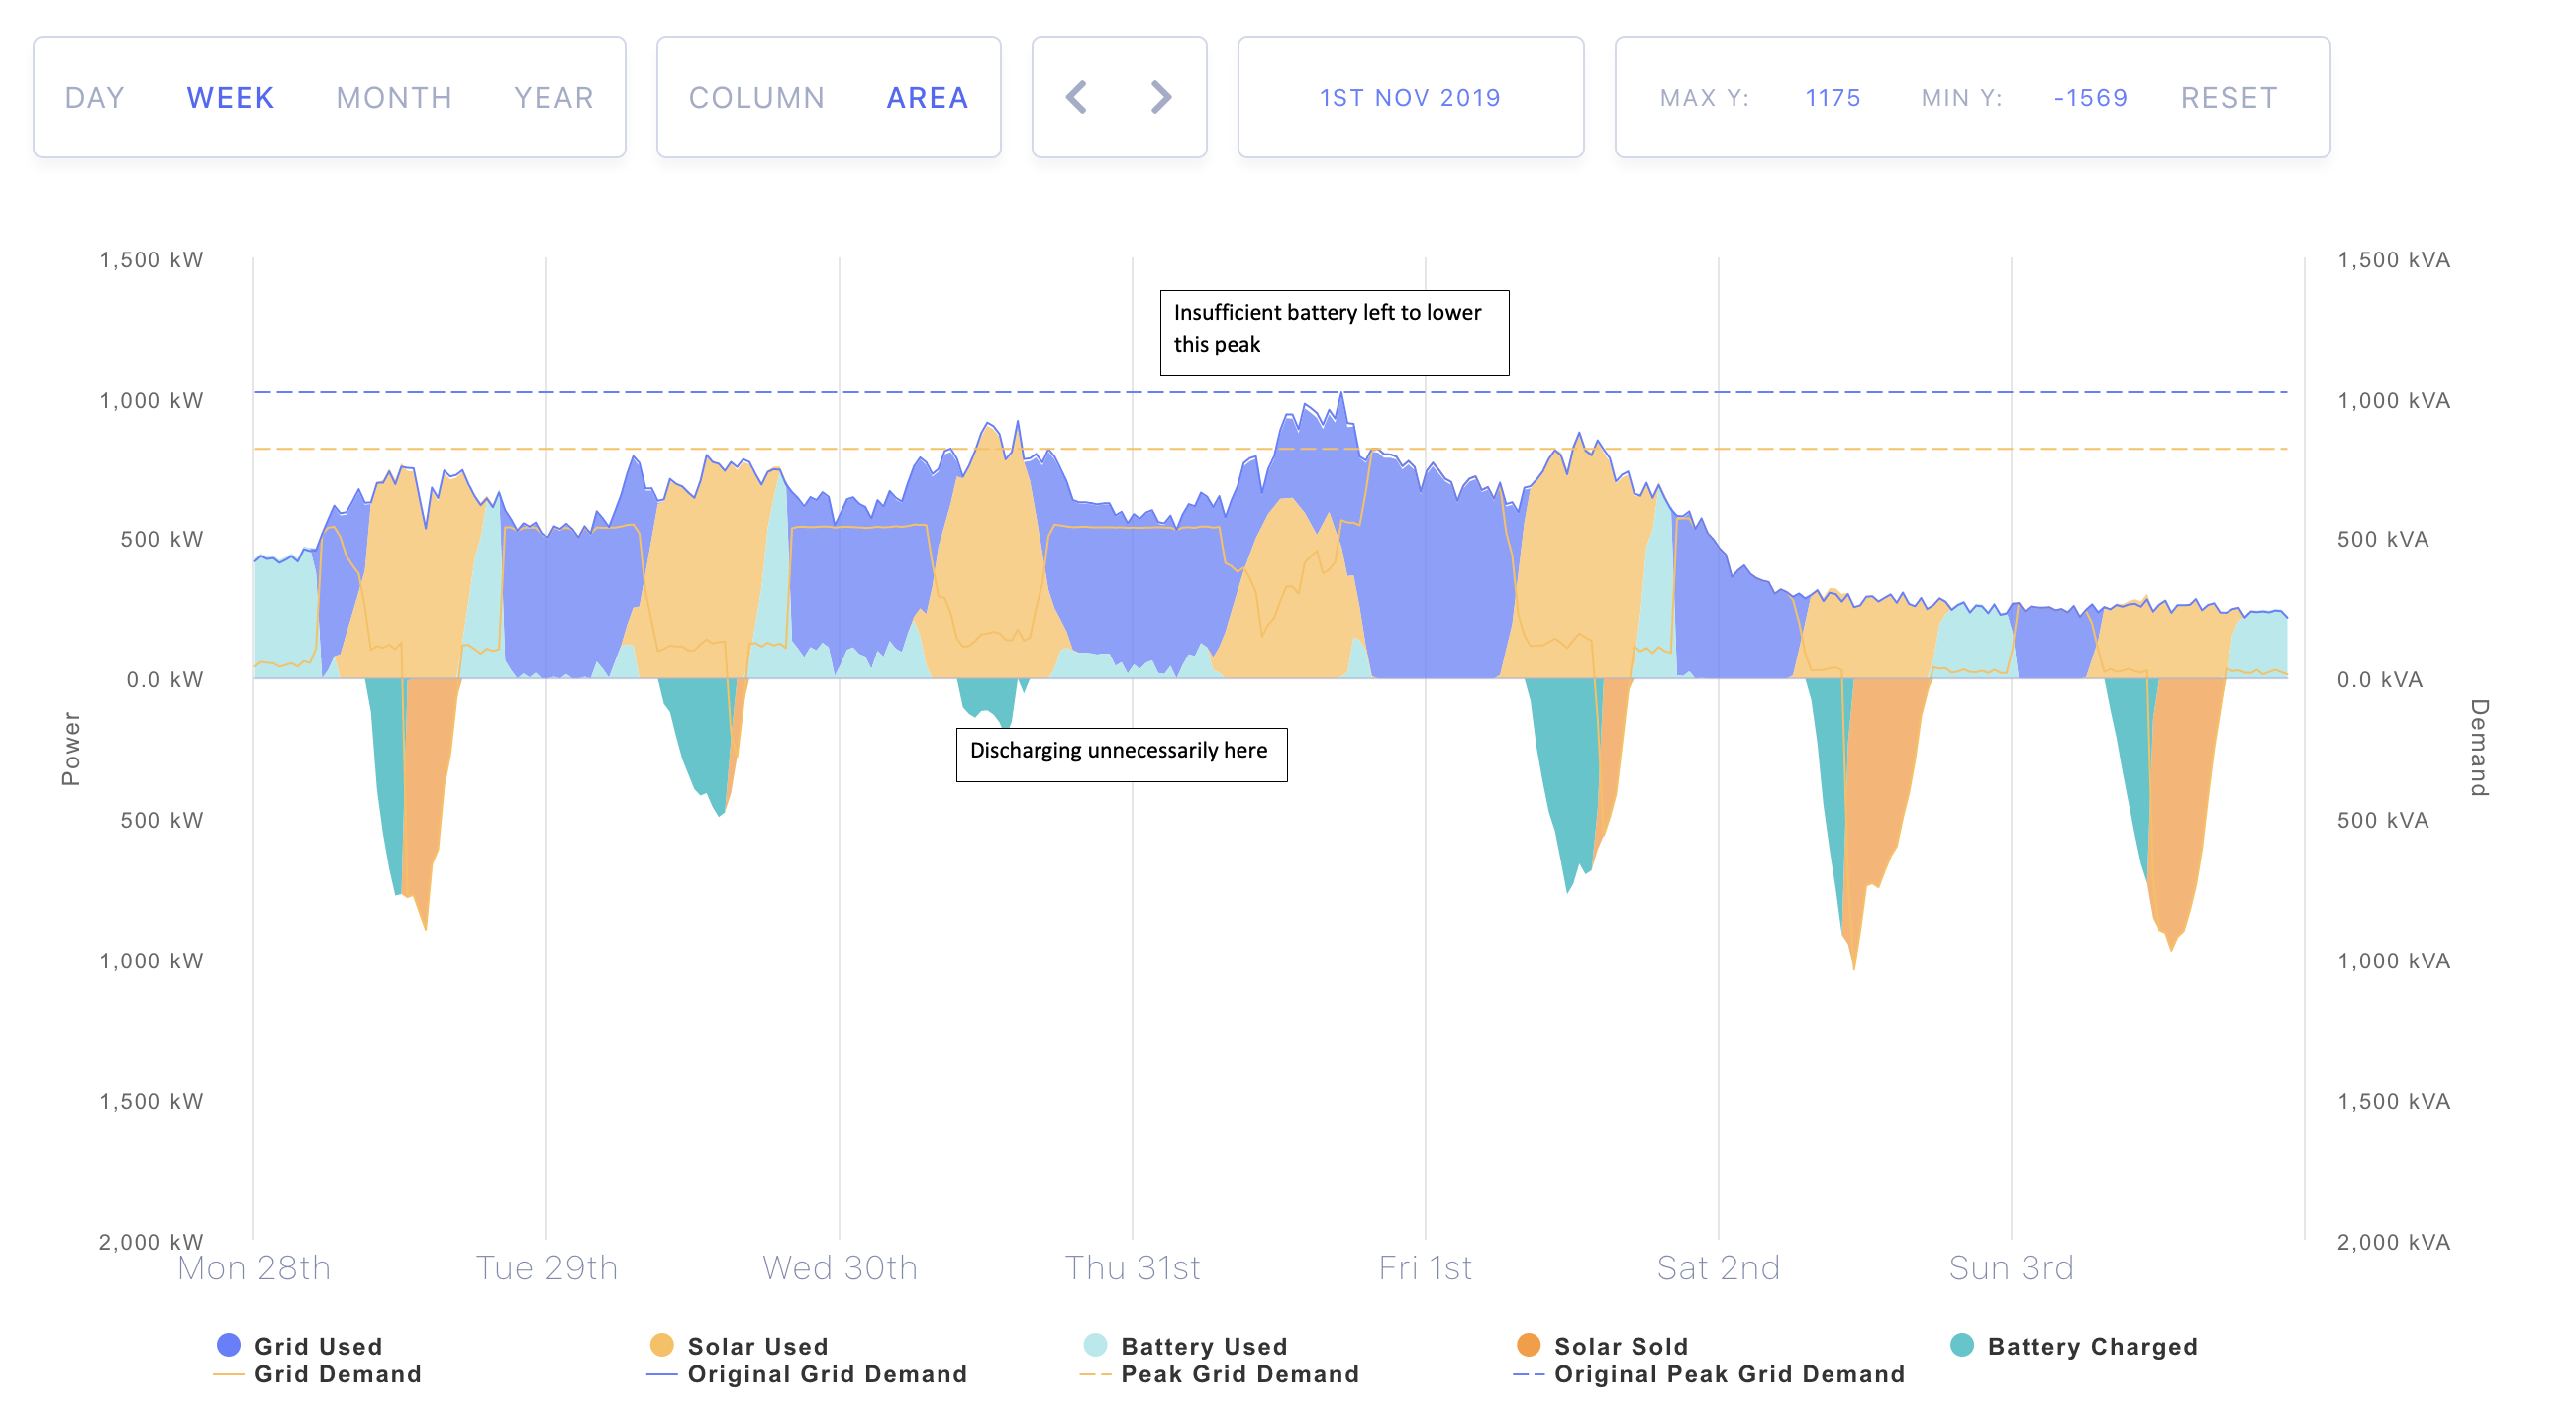
Ok then, now we need to set a threshold value at which point the battery starts to discharge. In the example above, the battery was selectively discharged every weekday just prior to the maximum grid demand (or more specifically, whenever the net demand was above this specified cut-off), and almost exclusively charged (not discharged) on the weekend when demand was low. Great! But what happens if we set this peak lopping threshold too low? Well, it would cause the battery to discharge more frequently, risking emptying it completely just before a larger peak is about to hit. This occurs in the example below, with the peak on Thursday afternoon unable to be reduced due to insufficient battery capacity.

The opposite is also true – if the threshold is set excessively high, potential savings are lost as the maximum grid demand could have potentially been reduced further.
The great threshold problem
So with this in mind, how exactly do we best determine this peak threshold? Here are three approaches we’re currently investigating.
- Set a hard threshold value. Likely a proportion of the maximum demand per any piece of interval data for each given month. This is possible, but doesn’t account for inter-variational differences between months as well as the shape of each specific month’s data.
- Machine learning. Learning the shape of the monthly data and variation between months based on large quantities of historical data to predict and validate the ideal threshold for any new site.
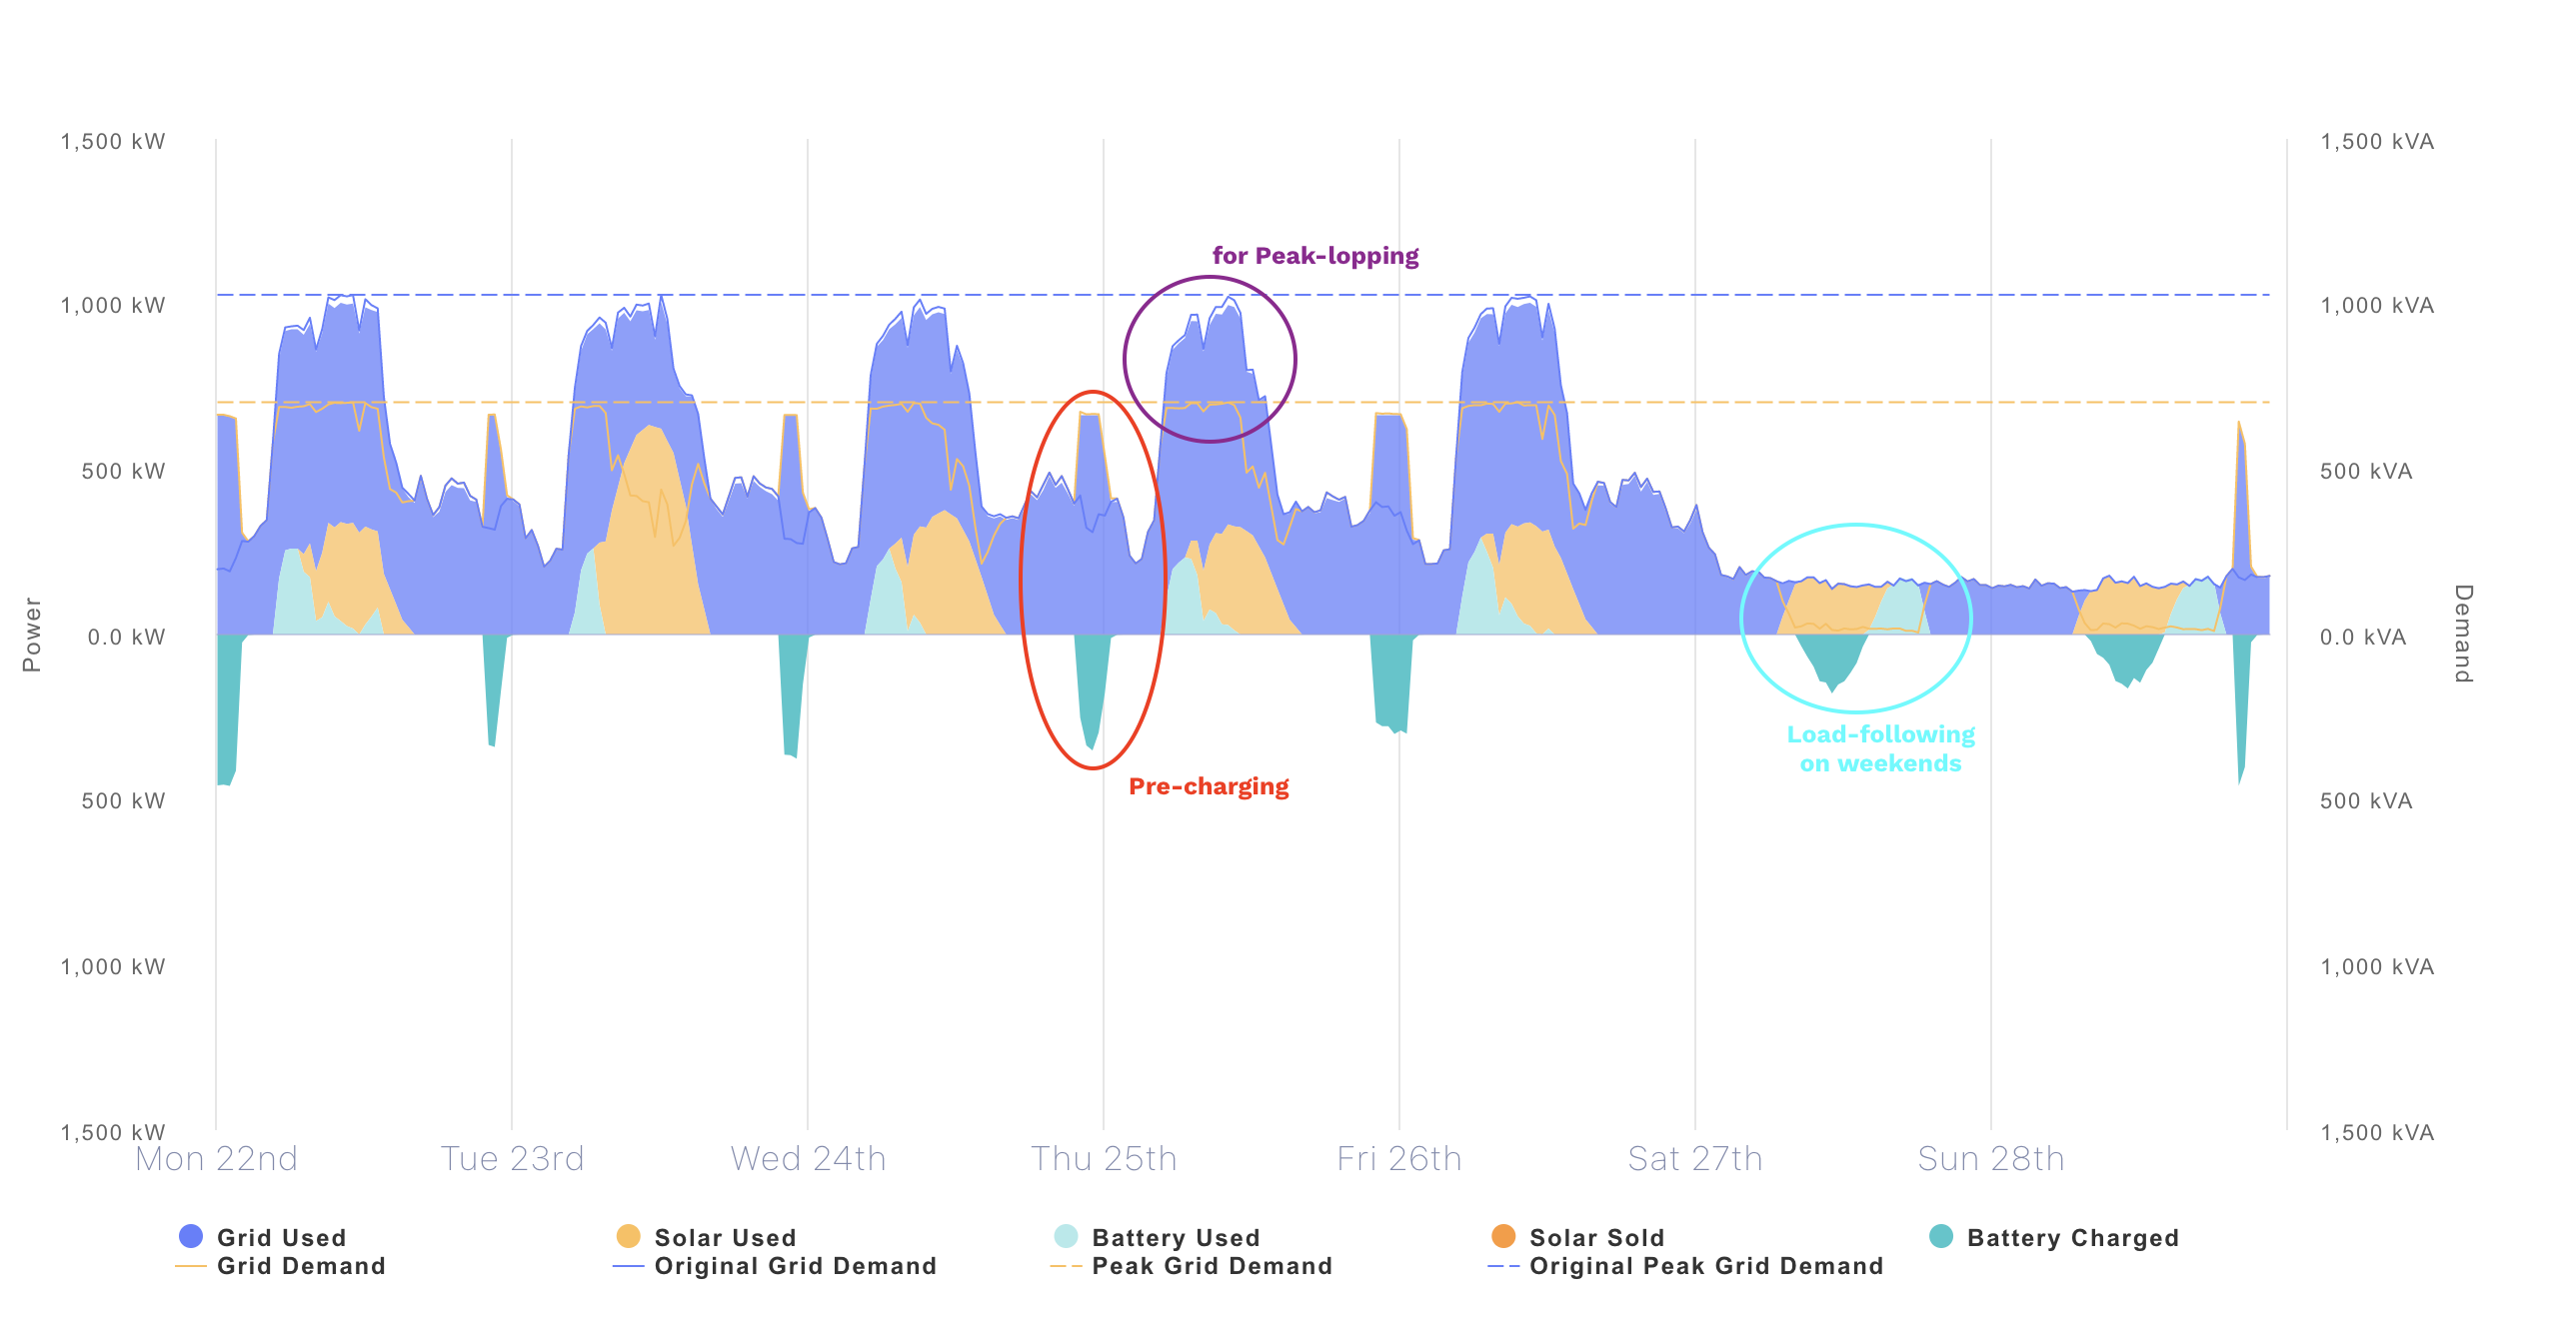
- Pre-charging. Charing the battery directly from the grid just prior to periods of maximum grid demand. This appears to work well, as illustrated below. We can see that pre-charging of the battery occurred Thursday morning in anticipation of the higher peak grid demand around midday.

Our battery model has come along leaps and bounds since that fateful day in early May, and will continue to improve as we devote more time to exploring other possible approaches. I certainty feel like it’s been an invaluable exercise to tackle as a team, and I hope you’ve been as entertained by the concept as we are.