Solar
Solar Outperforms for Victorian Red Meat Processor
A case study exploring PV system performance.
Discover the lifetime financial benefits of proper operation and maintenance for PV and battery systems on our blog.
What is it?
Deploying a comprehensive Operation and Maintenance (O&M) program on Photovoltaic (PV) and Battery systems radically increases the chance that the asset will perform at or above it’s expected production capabilities. Proactive, and to a lesser extent, reactive O&M services also reinforce investor confidence in the long-term performance and life-time revenue capacity of the asset.
Whilst this may be true in theory, many investors and owners are discouraged from undertaking O&M contracts or programs due to the ongoing costs, especially when considering rooftop solar projects, which are usually deployed with a “set-and-forget” mindset. This mindset is mostly a result of the spectacularly low failure rate of the PV modules themselves, at 0.02%-0.2% (Jordan et al., 2017), but rarely fully accounts for the much higher rates of failure for other componentry and hardware.
The addition of battery systems to PV componentry can resolve a number of key entry barriers of renewables grid integration and is an important pathway to increasing overall renewables penetration and grid energy reliability. Whilst adding storage components allows for assets to provide frequency response, reserve capacity, black-start capability, smoothing, and other grid services, they also increase the overall costs and complexity which need to be balanced against these benefits, increasing the necessity of active operation and maintenance.
The Economics of Operation and Maintenance
The economic benefits of any renewables O&M program can be quantified using two key measures: The Internal Rate of Return (IRR), and the risk of not meeting that predicted IRR.
For example, consider the following two hypothetical investment cases:
Investment A: The asset owner opts out of any operation and maintenance programs, as they preferred the higher IRR, as well as faster payback period. In this case, let’s say they IRR is 10%, and the risk of not meeting IRR is 10%.
Investment B: This asset owner has opted to contract a O&M provider to conduct preventative maintenance with KPI’s based on limiting downtime and maximising production. The IRR in this case may be 9%, and risk of not meeting IRR is approaching 0%
Whilst Investment A presents a better IRR, and therefore on the surface appears to be a better investment, the inclusion of the O&M provision in Investment B virtually maximises the certainty that the investment will actually reach the lower IRR value, and whilst both investments appear to be statistically equivalent, Investment B presents a significantly more risk averse option.
A Real-World Test Case
To help analyse the cost weighted benefits of a comprehensive O&M plan, let’s consider a 660 kW rooftop solar system, with no battery, and no power factor correction. The site is located in Brisbane QLD, and was installed in 2021.
The 660 kW system is comprised of 1400 PV modules, and 5 Solar Inverters, with an estimated net investment of $764,600. From here we can generate accurate estimates for the following:
Considering this system, we can estimate the overall replacement costs of the inverters to total ~$43,000. Applying a Weibull failure distribution curve of mean interval 20 years and shape factor 5, this predicts a failure probability of ~10%. We can generalise this approach to several other components which are less likely to fail, such as isolators, connectors, meters, and breakers.
Analysis of as conducted by Jordan et al., 2017, yielded the below data regarding component failure rates ad associated lost production as seen in Figure 1.
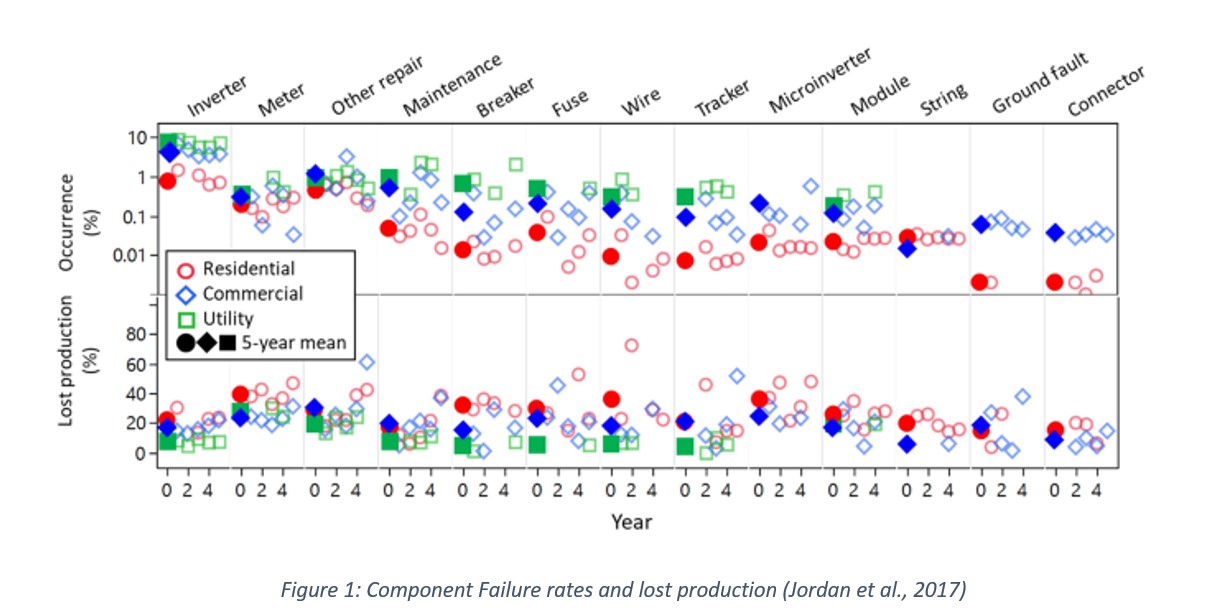
This tied in with the Solar Analytics reported statistic of “about 14% of the country’s solar systems develop a major fault every year and stop working altogether” (Are my solar panels working properly?), means we can reasonably assume a failure risk of 10% for rooftop PV systems.
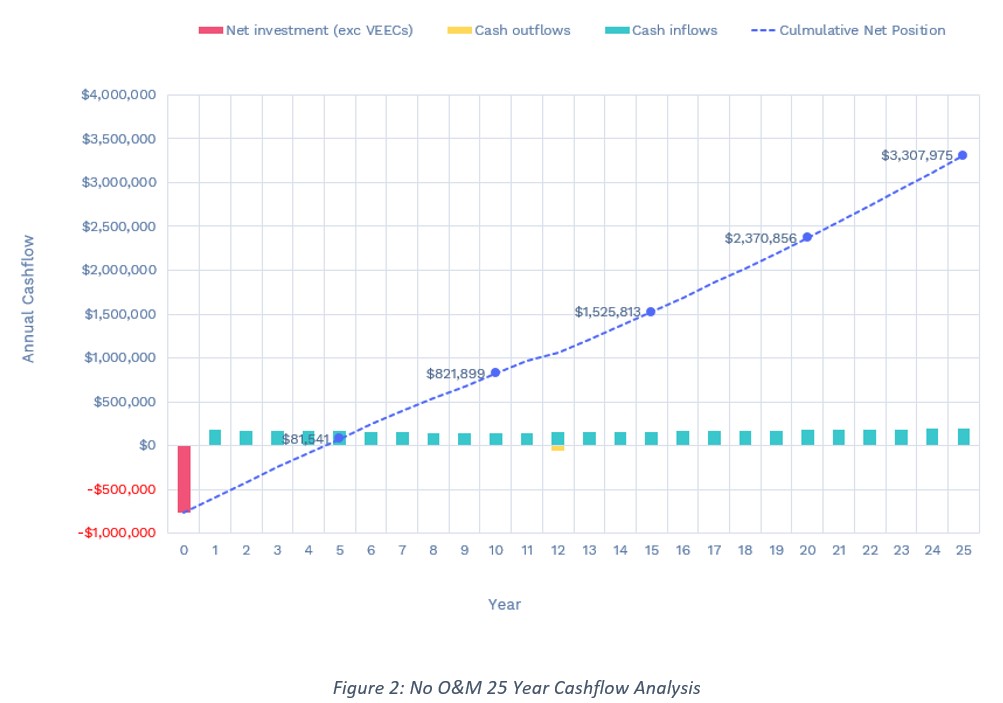
Without O&M:
The first test case is to consider this system under a no O&M case, where the asset owner has opted to not implement an operation and maintenance program, but will still conduct a 12 year inverter replacement, with no notable loss of production. In this case a 25 Year Cash flow analysis yielded an IRR of 21.1%, NPV of $948,400 and a payback period of 4.5 years (Figure 2).
As there is no O&M term included within the lifetime of this asset, as discussed above we can estimate the risk of the system not meeting the expected IRR to be ~10%.
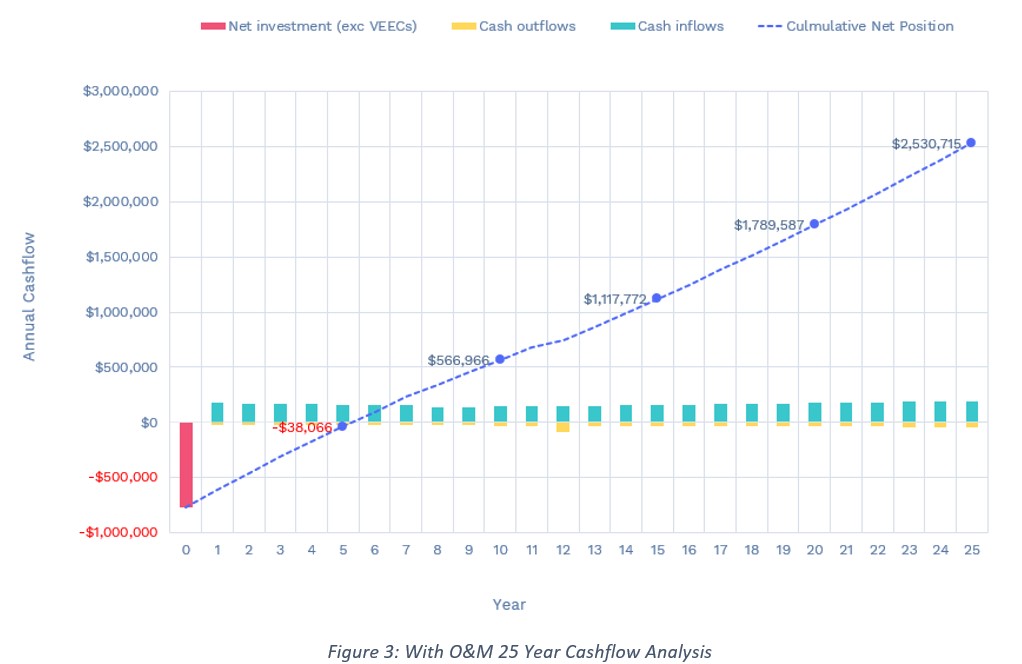
With O&M:
The second test case considers an asset owner who opted for a comprehensive O&M plan, including preventative maintenance, reactive maintenance, real-time monitoring, and with KPI’s based on limiting downtime and maximising production. The estimate cost of this service is ~$22,000 annually.
In this case a 25 Year Cash flow analysis yielded an IRR of 17.4%, NPV of $646,680 and a payback period of 5.3 years (Figure 3).
As there is an O&M term included within the lifetime of this asset, we can estimate the risk of the system not meeting the expected IRR to be approaching 0%.
Is it Worth it?
Whilst a comprehensive O&M program on PV and Battery systems, may decrease the internal rate of return of the investment, they drastically increase the chance that the asset will perform at or above it’s expected production capabilities.
Considering the real world example of a 660 kW rooftop solar system, the inclusion of a comprehensive O&M is projected to decrease the 25-year projected IRR from 21.1% to 17.4%, but virtually guarantees that the system will meet or exceed that expected value. As the complexity of these systems increases, with the addition of battery components, power factor correction, etc, the rate at which individual components fails increases substantially, as does the corresponding investment risk.
Without an O&M program, any system is likely to experience extended periods of downtime, resulting in both a loss of production, and escalating repair works. The additional risk of cascading component failure also adds to the economic value of preventative and reactive maintenance programs, making the comprehensive O&M plan a significantly more risk averse pathway.
References:
“Are my solar panels working properly?,” Solar Monitoring System. [Online]. Available: https://www.solaranalytics.com.au/community-news/are-my-solar-panels-working-properly. [Accessed: 29-Dec-2022].
D.C. Jordan, T. J. Silverman, J. H. Wohlgemuth, S. R. Kurtz, and K. T. VanSant, “Photovoltaic failure and degradation modes,” Progress in Photovoltaics: Research and Applications, vol. 25, no. 4, pp. 318–326, 2017.A case study exploring PV system performance.
A case study exploring PV system performance.
How and Why Beam Solar Audits the Solar Installs on its Platform.